
[LDA & QDA] Understanding Linear Discriminant Analysis and Quadratic Discriminant Analysis
Linear Discriminant Analysis(LDA)
-
Linear discriminant analysis(LDA) is to find a linear combination of features that characterizes or separates two or more classes of objects or events by using distributions of sample.
-
From the figure below, the linear discriminant vector projected on LD1 classifies the sample well into two classes while the linear discriminant vector projected on LD2 does not.
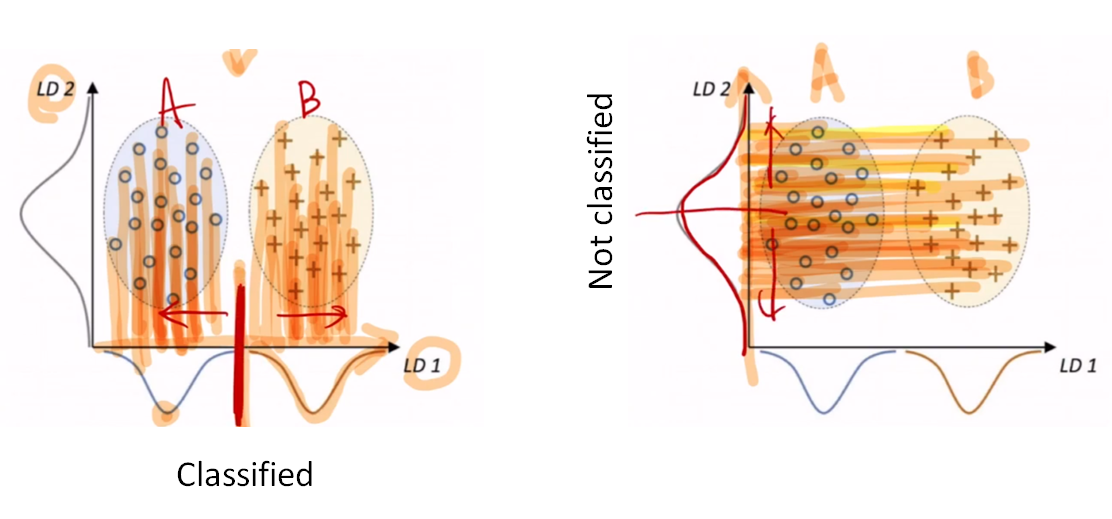
- Two assumptions of LDA
- Each class group is following a normal distribution.
- All the class groups share the same/similar covariance matrix(homoscedasticity).
-
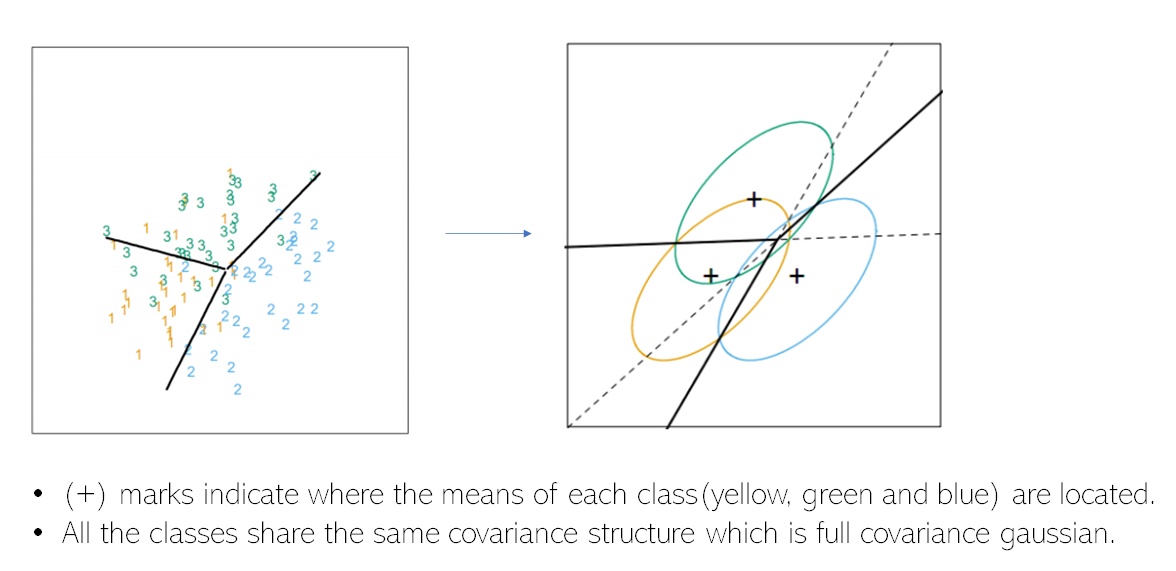
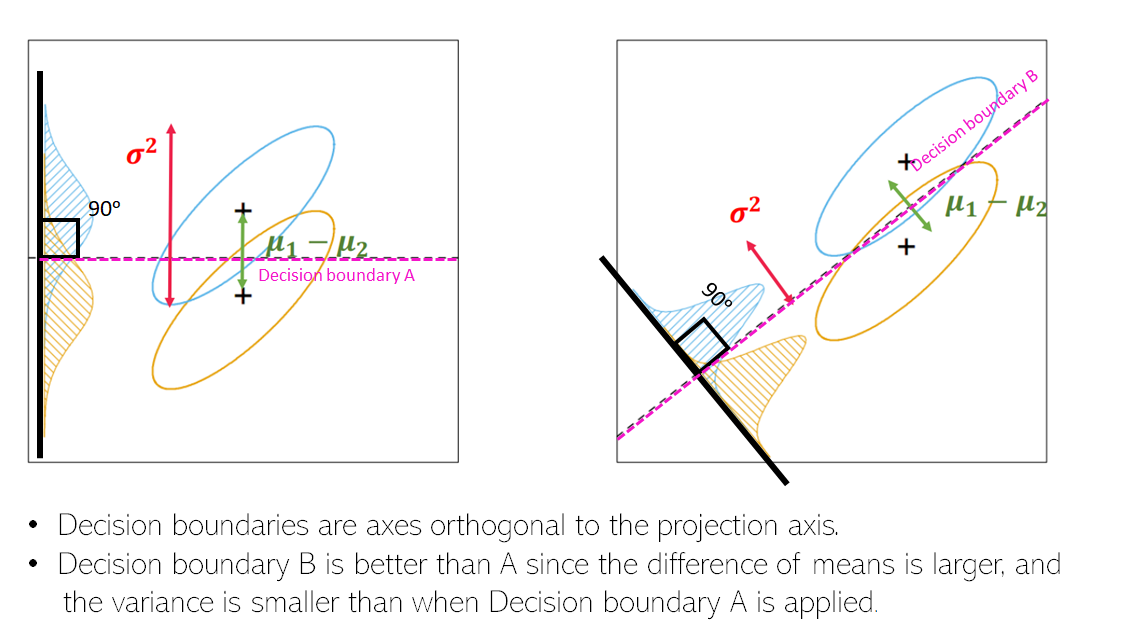
Decision boundary of LDA
- Decision boundaries of LDA place where the difference of means of each class groups is large and the variance of each group of classes is small.
- Pros and Cons of LDA
- Pros: (1) LDA reflects the covariance structure of variables (cf. Naïve Bayes assume conditional independence). (2) LDA operates relatively robust even if the assumptions are slightly violated.
- Cons: (1) The size of the smallest group should be larger than the number of predictor variables. (2) It does not work well if it deviates greatly from the assumption of normal distribution. (3) When class groups do not share the same/similar covariance matrix, we should use quadratic discriminant analysis(QDA).
Quadratic Discriminant Analysis(QDA)
- Quadratic discriminant analysis(QDA) is a variant of LDA in which a different individual covariance matrix is estimated for every class. In other words, QDA can be applied if the homoscedasticity assumption of LDA is not satisfied.
- Comparison QDA with LDA:
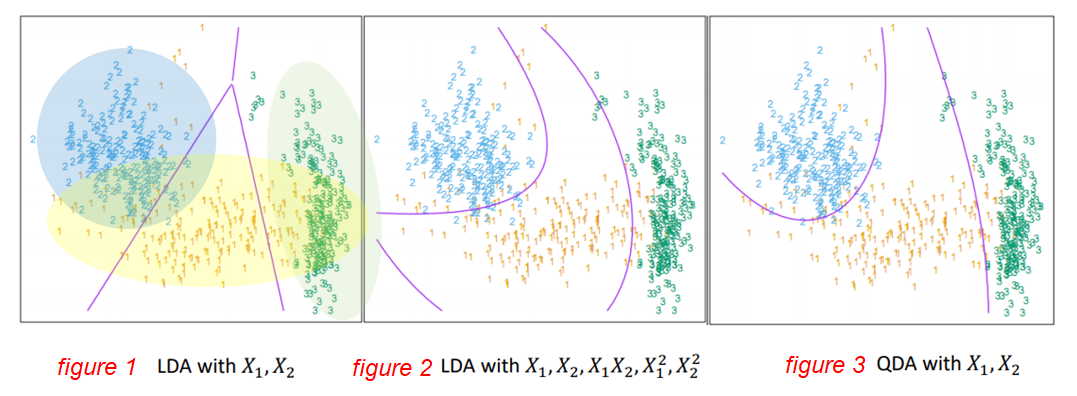
- In the figure 1 above, LDA assumes that all the classes have same covariance structure, even though class2(blue) has sphere covariance and the others(yellow and green) have diagonal covariance. The decision boundaries of LDA are linear so that it is difficult to classify when each class has different structures of covariance.
- Yet in the figure 2, through data augmentation, non-linear classification can be possible in LDA. Then, two similarly shaped curves classify the classes in the second figure (Data augmentation in data analysis are techniques used to increase the amount of data by adding slightly modified copies of already existing data or newly created).
-
Finally in the figure 3, the classes are better classified as QDA is applied by considering that individual classes exhibit distinct covariances.
- Since QDA estimates a covariance matrix for each class, it has a greater number of effective parameters than LDA. Therefore, it requires heavier computation.
More to read
Reference
- 세종대*최유경 교수 7주차 판별분석 Part1(유튜브 강의): https://www.youtube.com/watch?v=YUQF5veIvxE
- Linear discriminant analysis: https://en.wikipedia.org/wiki/Linear_discriminant_analysis
- DATA SCIENCE BLOG Linear, Quadratic, and Regularized Discriminant Analysis: https://www.datascienceblog.net/post/machine-learning/linear-discriminant-analysis/#:~:text=and%20vice%20versa.-,Quadratic%20discriminant%20analysis,individual%20classes%20exhibit%20distinct%20covariances
- Data augmentation: https://en.wikipedia.org/wiki/Data_augmentation