
Understanding binomial coefficient and conditional probability with R script
1. Binomial coefficient and probability
(1) Using choose( ) to calculate a binomial coefficient
  choose(10, 2) # the number of sets with 2 elements that can be chosen from a set with 10 elements.

## [1] 45

  choose(45, 6) # the number of sets with 6 elements that can be chosen from a set with 45 elements.

## [1] 8145060
(2) The binomial coefficient of Lottery 6/45
  choose(45, 6)

## [1] 8145060
(3) The probability of winning the first prize in Lottery 6/45
  1 / choose(45, 6)

## [1] 1.227738e-07
(4) The probability of winning the fifth prize in Lottery 6/45
  choose(6, 3)*choose(39, 3) # picking three from winning numbers and the other three from the rest

## [1] 182780

  choose(6, 3)*choose(39, 3) / choose(45, 6)

## [1] 0.0224406
2. Calculating conditional probability using logical operators
(1) Making a set(n=10) of English and math scores
  SCORES = data.frame(
    english_score= c(60,70,74,78,80,83,85,90,95,100),
    math_score = c(75,70,60,85,100,84,94,70,90,92))

  SCORES

##    english_score math_score
## 1             60         75
## 2             70         70
## 3             74         60
## 4             78         85
## 5             80        100
## 6             83         84
## 7             85         94
## 8             90         70
## 9             95         90
## 10           100         92
(2) Selecting an interest variable from the data
  SCORES$english_score

##  [1]  60  70  74  78  80  83  85  90  95 100
(3) Applying logical operators to see if each observation satisfies the condition
  SCORES$english_score>=90

##  [1] FALSE FALSE FALSE FALSE FALSE FALSE FALSE  TRUE  TRUE  TRUE
(4) Counting the number of observations satisfying the condition
  sum(SCORES$english_score>=90)

## [1] 3
(5) Using mean( ), calculating the conditional probability
  mean(SCORES$english_score>=90)

## [1] 0.3

  mean(SCORES$math_score>=90)

## [1] 0.4
(6) Using &, calculating the probability that satisfying both two conditions
  mean(SCORES$english_score>=90 & SCORES$math_score>=90)

## [1] 0.2
(7) Using |, calculating the probability that satisfying one of the two conditions
  mean(SCORES$english_score>=90 | SCORES$math_score>=90)

## [1] 0.5
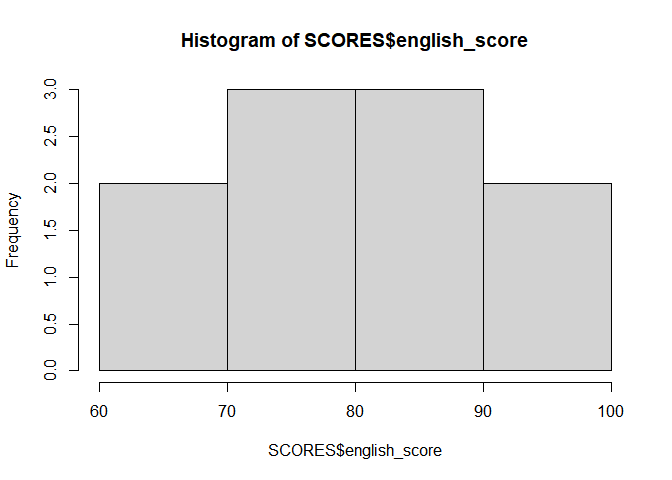
(8) Making a histogram of one variable
hist(SCORES$english_score)
hist(SCORES$english_score, probability=TRUE)
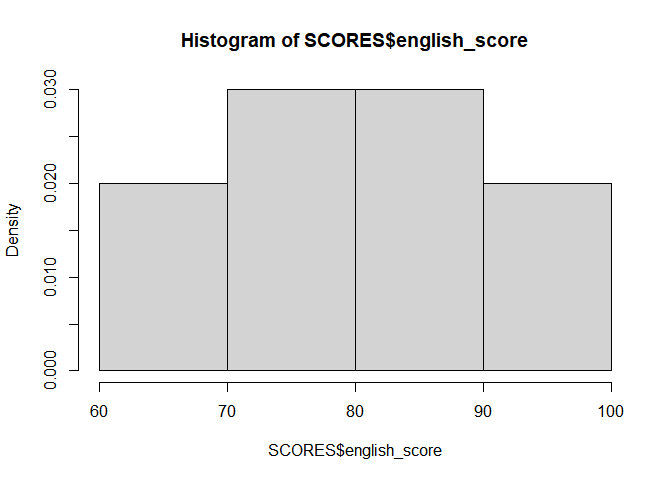
## Changing y-axis into density
3. Calculating conditional probability using subset( )
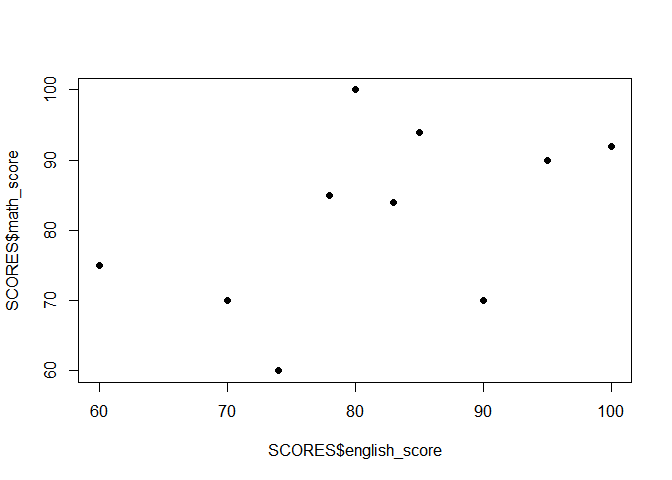
(1) Making a scatterplot with two variables
plot(SCORES$english_score, SCORES$math_score, pch=16)
(2) Using subset( ), making subsets
  MATH_GOOD = subset(SCORES, math_score>=80)
  MATH_GOOD

##    english_score math_score
## 4             78         85
## 5             80        100
## 6             83         84
## 7             85         94
## 9             95         90
## 10           100         92

  MATH_BAD = subset(SCORES, math_score<80)
  MATH_BAD

##   english_score math_score
## 1            60         75
## 2            70         70
## 3            74         60
## 8            90         70
(3) Calculating conditional probability from the subsets
  mean(MATH_GOOD$english_score>=90)

## [1] 0.3333333

  mean(MATH_BAD$english_score>=90)

## [1] 0.25