
[T-test]Testing the Significance of the Correlation Coefficient with R script
1. Testing the significance of the correlation coefficient between study hour and score(n=9)
(1) Opening the file
  TWO_CONT = read.csv('data/TWO_CONT.csv', fileEncoding='UTF-8')
  TWO_CONT

##   HOUR SCORE
## 1    0    60
## 2    4    78
## 3    3    83
## 4    6    74
## 5    6   100
## 6    7    80
## 7    8    90
## 8    8    85
## 9    3    70
There are two numerical variables: study hour and score.
(2) Drawing a scatterplot with trend lines
  plot(TWO_CONT, pch=16, col='dodgerblue')+
  abline(v=mean(TWO_CONT$HOUR), lty=2)+
  abline(h=mean(TWO_CONT$SCORE),lty=2)
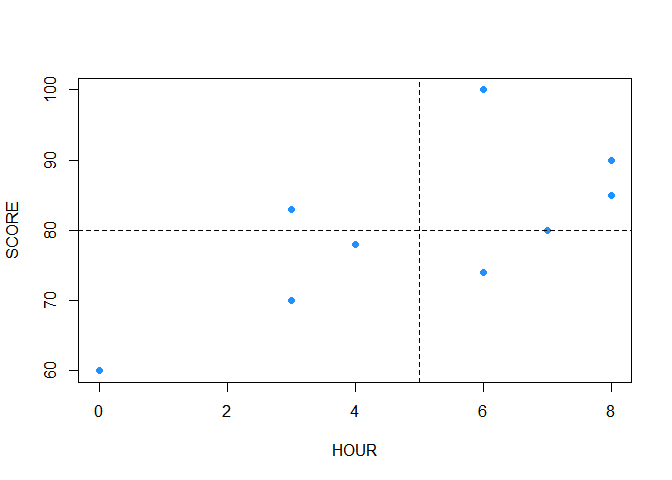
The scatterplot implies that there is a positive correlation between study hour and score. Then, let’s calculate the correlation coefficient.
(3) Using cor( ), calculating the correlation coefficient between study hour and score
  cor(TWO_CONT$HOUR, TWO_CONT$SCORE)

## [1] 0.7011677
The P-value 0.7 also indicates there is a positive correlation between study hour and score. Let’s do a statistical test(t-test) on this correlation coefficient.
(4) BEFORE using the t-test function, let’s try to find t-value and t-distribution manually following the t-test formula.
  cor(TWO_CONT$HOUR, TWO_CONT$SCORE)

## [1] 0.7011677

  r_xy = cor(TWO_CONT$HOUR, TWO_CONT$SCORE)
  r_xy

## [1] 0.7011677

  n = nrow(TWO_CONT)
  n

## [1] 9

  # the degree of freedom is set as n-2
  t_value = sqrt(n-2) * r_xy / sqrt(1-r_xy^2)
  t_value

## [1] 2.601858

  pt(t_value, (n-2))

## [1] 0.9823353
(5) Yet, using cor.test( ), one can easily obtain a summary of the test.
  cor.test(TWO_CONT$HOUR, TWO_CONT$SCORE)

##
##  Pearson's product-moment correlation
##
## data:  TWO_CONT$HOUR and TWO_CONT$SCORE
## t = 2.6019, df = 7, p-value = 0.03533
## alternative hypothesis: true correlation is not equal to 0
## 95 percent confidence interval:
##  0.06933049 0.93151807
## sample estimates:
##       cor
## 0.7011677
According to the P-value, the null hypothesis (no correlation) is rejected and it can be said that there is a relationship between study hour and score.
2. Testing the significance of the correlation coefficient between dad-son’s height(n=1,078)
(1) Opening the file
  heights = read.csv('data/heights.csv')
  head(heights)

##     father      son
## 1 165.2232 151.8368
## 2 160.6574 160.5637
## 3 164.9865 160.8897
## 4 167.0113 159.4926
## 5 155.2886 163.2741
## 6 160.0773 163.1752

  nrow(heights)

## [1] 1078
(2) Drawing a scatterplot with trend lines
  plot(heights, pch=16, col='#3377BB77')+
  abline(v=mean(heights$father), lty=2)+
  abline(h=mean(heights$son),lty=2)
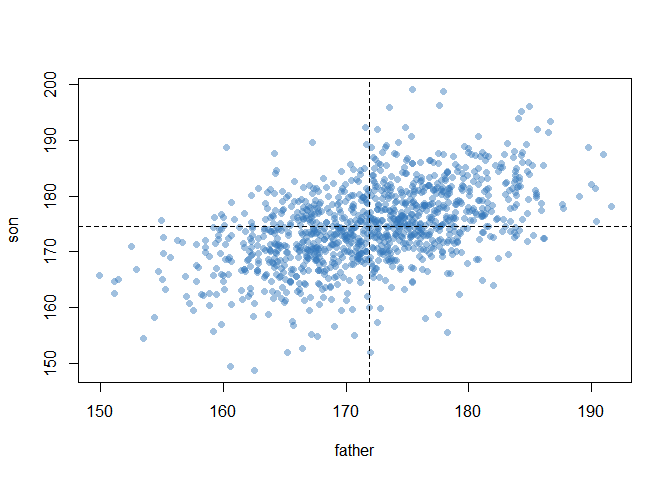
(3) Using cor( ), calculating the correlation coefficient between dad’s height and son’s height
  cor(heights$father, heights$son)

## [1] 0.5013383
There is a positive correlation(0.50) between dad-son’s height.
(4) Using cor.test( ), testing the significance of the correlation coefficient.
  cor.test(heights$father, heights$son)

##
##  Pearson's product-moment correlation
##
## data:  heights$father and heights$son
## t = 19.006, df = 1076, p-value < 2.2e-16
## alternative hypothesis: true correlation is not equal to 0
## 95 percent confidence interval:
##  0.4552586 0.5447396
## sample estimates:
##       cor
## 0.5013383
This correlation is statistically significant according to the result of the t-test.
More to read
-
https://blog.minitab.com/en/adventures-in-statistics-2/understanding-t-tests-1-sample-2-sample-and-paired-t-tests
-
https://courses.lumenlearning.com/introstats1/chapter/testing-the-significance-of-the-correlation-coefficient/#:~:text=The%20formula%20for%20the%20test,combined%20area%20in%20both%20tails.
Reference
- 패스트 캠퍼스 데이터 분석 입문 올인원 패키지 강의